
S2P2 is a powerful predictive simulation for hiring new salespeople, however, it is equally powerful as a diagnostic to identify the strengths and weaknesses of your existing sales team.
The war for sales talent has made it more difficult, time-consuming, and expensive to hire salespeople than most of us can remember. Open sales positions cause sales leaders excruciating pain because hitting quotas are next to impossible when you have open territories and uncovered accounts.
It is almost always best to retain rather than replace a sales rep. As such, retaining reps starts by helping them achieve quotas and maximize their earning potential. This is best done through individualized coaching that addresses each rep’s specific needs.
To learn how much turnover is costing you, start by downloading our Turnover Cost Calculator.
Then, follow the below example to customize the cost calculator for your organization.
1. Initial Assumptions
To calculate the cost of sales rep turnover you will need to know the basic design of the job’s compensation package and make some assumptions based on historic averages for your company.
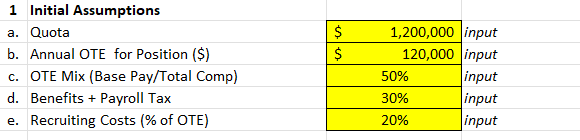
Start by determining the quota for the job (row a.), the on-target earnings or OTE(row b.), and the OTE mix of base salary and commission (row c.). You should also include the cost of benefits and payroll tax as a percentage of base salary (row d.), which is commonly estimated at 30%, and your recruiting costs as a percentage of OTE (row e.).
Note that recruiting costs can vary depending on whether you outsource recruiting or use an in-house recruiting team. If you use an in-house recruiting team, then you need to consider the cost of your recruiter’s time as well as the costs to promote the job-on-job boards or other channels.
In this example below, let’s assume that a rep carries a $1,200,000 quota and has an OTE of $120,000. The OTE breaks down into 50% base salary (i.e., $60,000) and 50% in commission (i.e., $60,000) if the plan is achieved. We’ll use the standard 30% assumption for benefits and payroll tax and assume recruiting costs of 20% of a rep’s first year OTE (i.e., $24,000).
2. Opportunity Cost of Sales Rep Turnover (Yr.1)
In sales, time is money, and opportunity costs reflect lost selling production while the role is unfilled until the new hire is at full production.
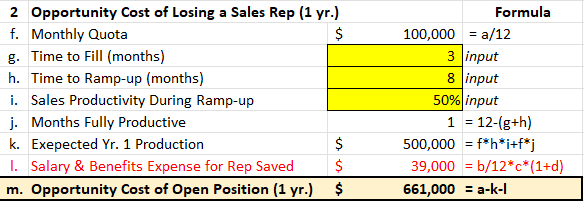
In our example, we’ll start by calculating the monthly quota (row f.). Assume it takes three months to fill the role (row g.), and there is no production during that time.
The role then gets filled and the new hire starts to ramp up. This learning period will vary based on the experience of your new hire and the complexity of your solution. An outside hire usually takes much longer to ramp up than an internal hire. In our example, we’ll use 8 months (row p.) from the time the rep is hired to the time they are firing on all cylinders. Assuming they ramp in a straight line, they will be operating at 50% of their full production (row i.).
This leaves just one month of the year to sell at full production (row j.).
Doing the math, the new hire’s expected production in their first year is about $500K (row k.). Keep in mind that during the three months the role is open, you are saving the compensation, benefits, and payroll taxes you would have paid if the role was filled (row l.). This means that you lose $700K in quota contribution but save $39K in payroll leading to a total opportunity cost of $661K (row m.) for the open sales position.
3. Hard Costs of Replacing a Sales Rep
For this example, we’re only considering the recruiting costs of $24K (row n.) as the hard costs. If the rep fails, and many do, the hard costs will add up even more very quickly.

4. Total Hard and Opportunity Costs of Sales Rep Turnover

Note that the opportunity cost of $661K (row m.) exceeds the hard costs ($24K) by over 25x and that the total hard cost and opportunity cost equals $685K (row 4)!
How S2P2 as a Diagnostic Reduces Turnover Cost
The output of an S2P2 diagnostic is a heat map that identifies the strengths and weaknesses of your existing sales team. 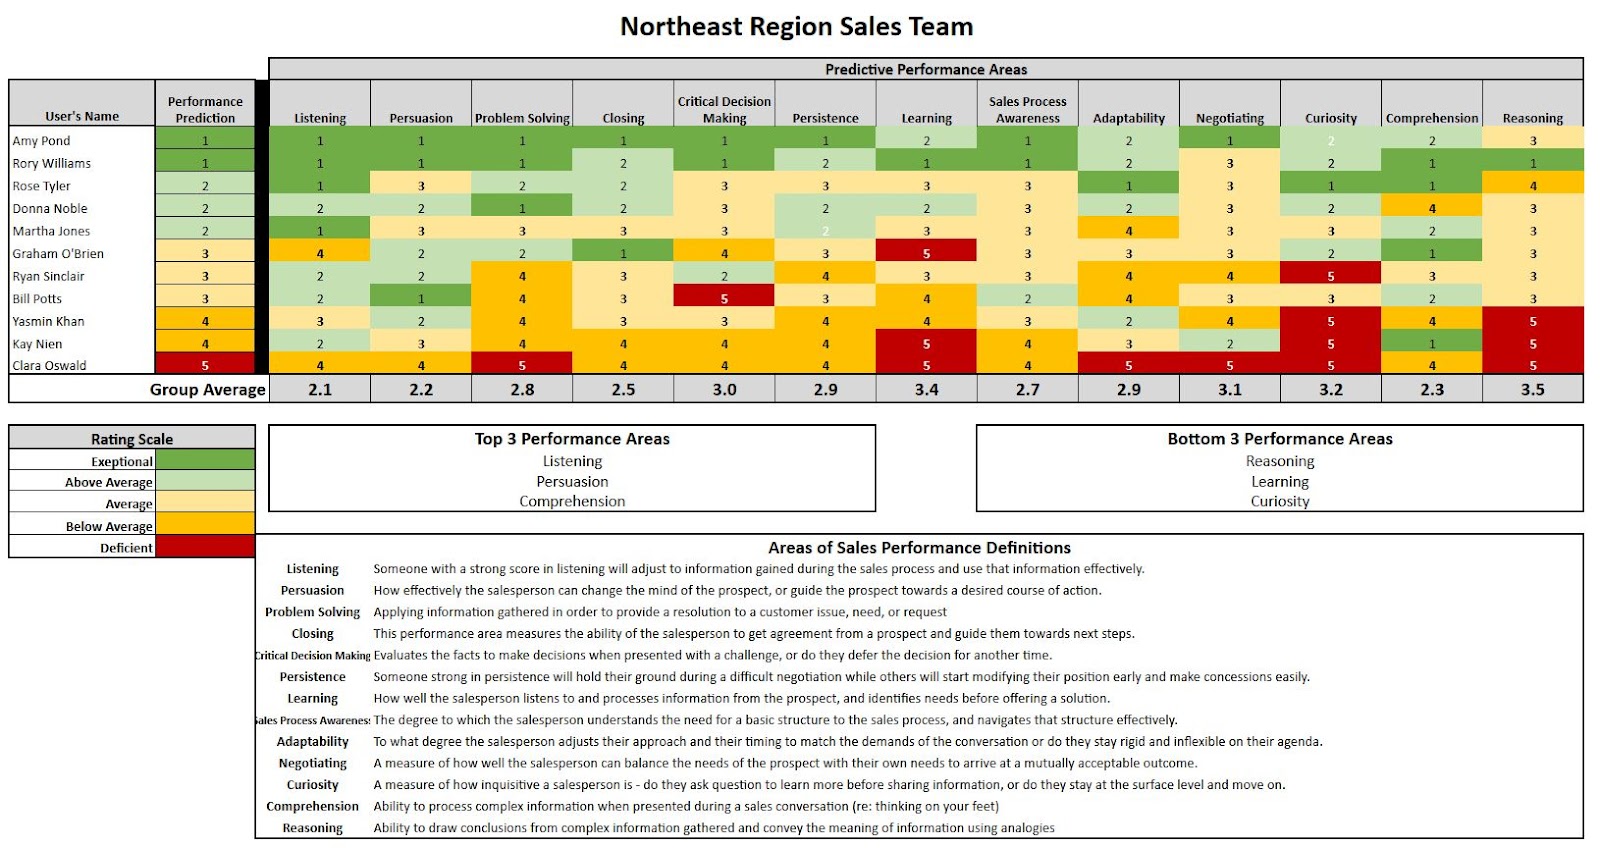
Insight from the heat map enables many powerful applications to retain and improve your team, such as:
1. Knowing the weaknesses of marginal performers to focus your training and coaching on preventing failure and turnover.
2. Knowing the strengths of your top performers to help replicate those strengths across your entire team.
3. Saving time and money on “one size fits all” training and coaching that is too general.
4. Using insight to create competency benchmarks for hiring, promotions, and internal mobility.
Author: Dario Priolo
Dario brings over 20 years of experience in the sales enablement and talent development industry. He has led marketing and strategy as CMO for leading companies like the Hay Group, Miller Heiman and Profiles International and has been part of 4 successful exits, including his own start-up.